During my internship at Sisense, I led a team of fellow students as part of the product team. We worked on three projects: integrating AI into the platform, improving the user onboarding experience, and redesigning the product’s information architecture.
Throughout the internship, I led in-depth interviews and user research, defined key user flows, and crafted design solutions that were successfully implemented into the product
Scope: 4 Months College Internship
Role: UX Research, UI Design, UX writing
Tools: Figma, AI Tools, Miro, Slack, Gong

Problem Statement
Sisense is a BI and data analytics platform that helps organizations visualize and embed data-driven insights into their products and workflows.
During the internship, Sisense was undergoing a significant strategic shift that included:
-
Transitioning toward a Product-Led Growth (PLG) model
-
Enabling a self-service experience
-
Making the platform more accessible to non-BI personas
Projects
Each project was at a different phase in the product lifecycle, requiring tailored design approaches and deliverables suited to its specific stage.
1.
Trial & Onboarding
Refining the onboarding flow by designing setup wizards and enhancing the sidebar to support self-service adoption
2.
AI Assistant
Conducting usability testing and evaluating layout concepts to define a more intuitive and effective model
3.
Usability Improvements
Identifying common pain points and proposing feature concepts to streamline core workflows
Initial Research
Before delving into the projects, my team and I conducted broad research to deeply understand Sisense’s product, users, and internal challenges:
-
12 semi-structured interviews with several departments such as Product, Support, Sales and technical teams
-
Listening to real customer calls with CS and Sales Engineers
-
Review of internal company documents such as reports, ICP and user flows


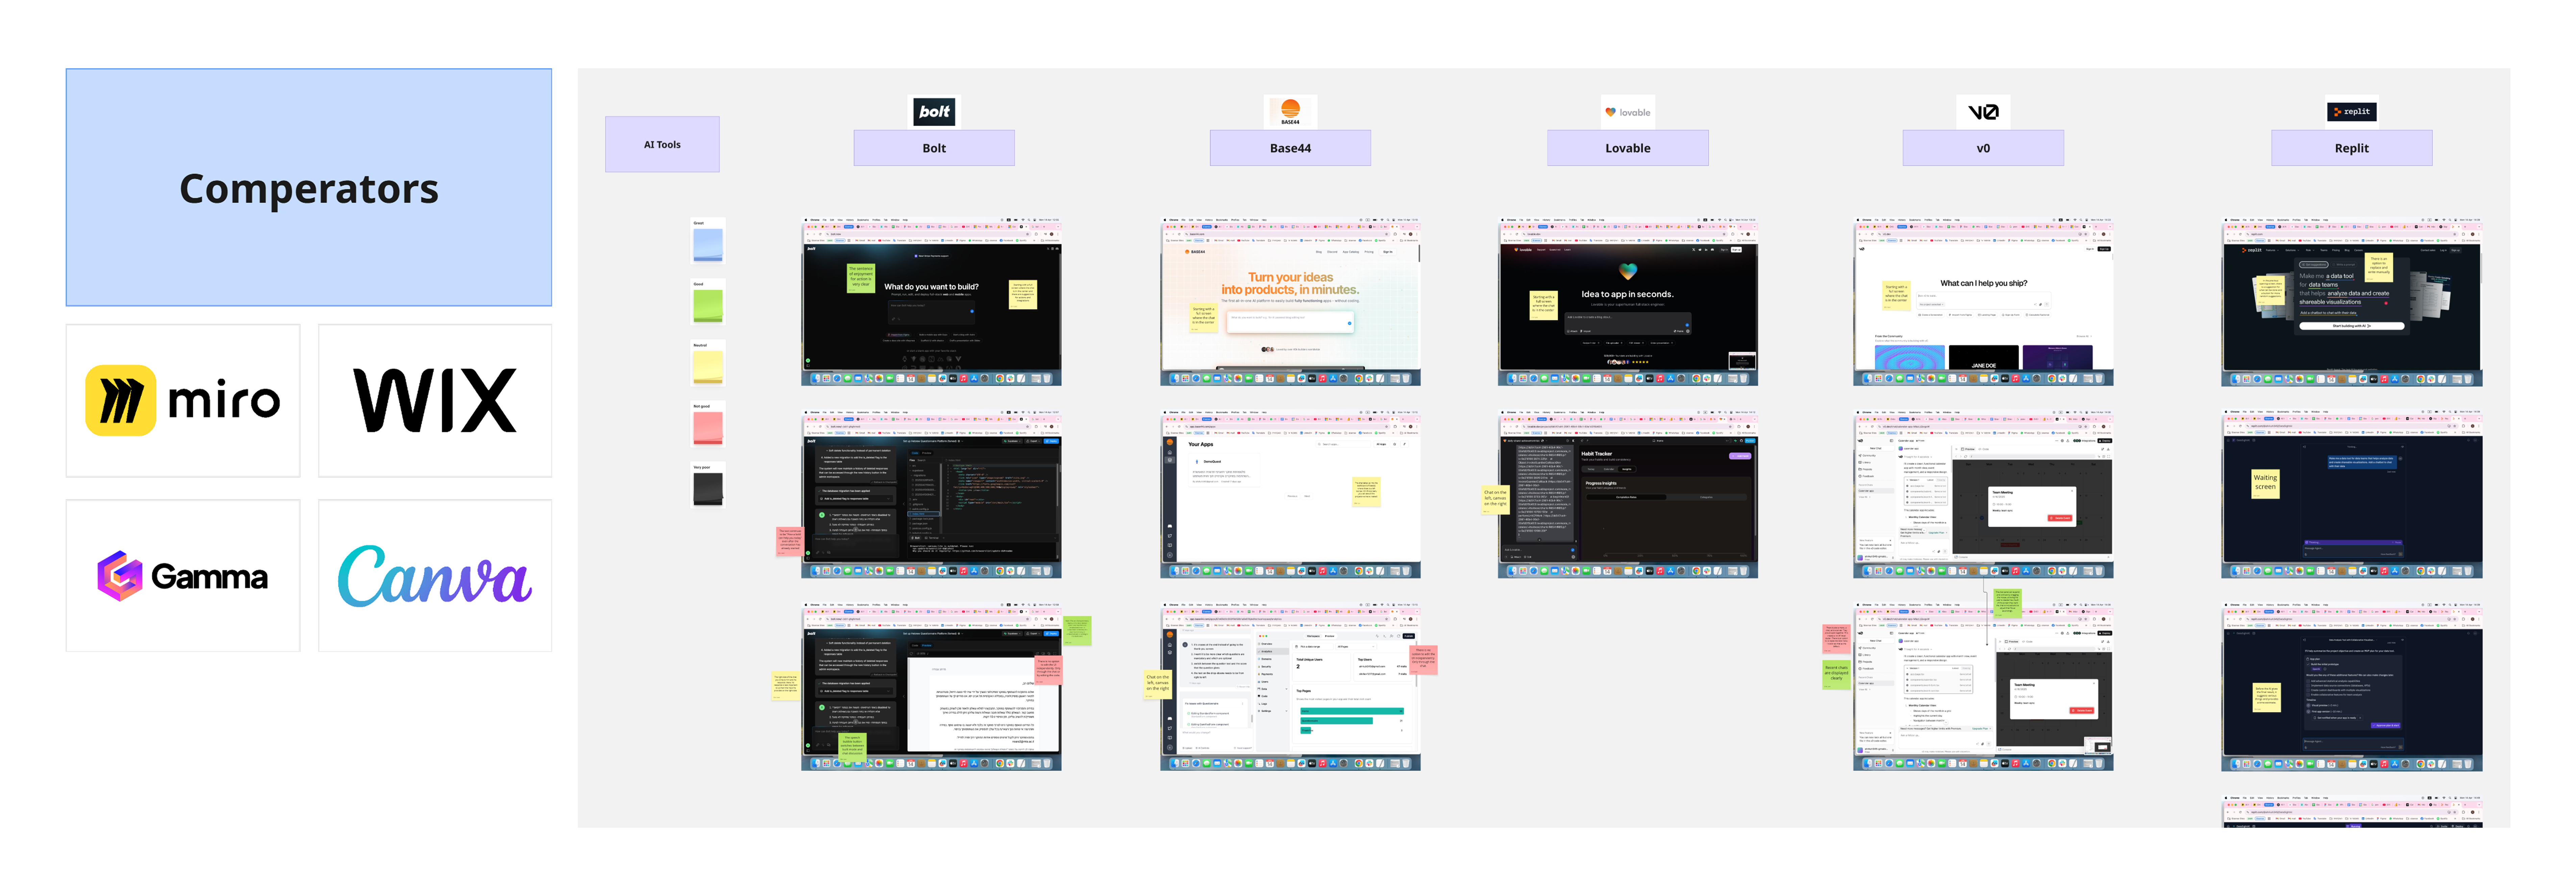
Competitive & Comparative Research
BI Competitors
Leading BI platforms such as Power BI and ThoughtSpot
Comparative Tools
To draw inspiration for usability, workflows, and patterns
AI Tools
AI-powered assistants and agents to understand best practices


Target Audience
-
Technical BI professionals who create dashboards and manage data models
-
Non-technical business users who consume data insights
-
Developers embedding Sisense into third-party products (B2B2C)
As the company moves toward Product-Led Growth (PLG) and self-service experience, our work focused especially on helping less-technical BI users succeed independently.
HMW - How Might We
This process involves reframing the core theoretical problem into actionable, user-centered questions. During a brainstorming session, we generated numerous questions and selected three key ones - one for each project:
-
How might we create a simple onboarding process that highlights added value from the very first step?
-
How might we help users perform actions and process data easily with AI, even without deep BI knowledge?
-
How might we provide users with contextual support and information without interrupting their workflow?

Project 1 - Trial & Onboarding Experience
KPIs
-
Maximize users uploading actual data (not just sample data)
-
Minimize support/solution engineer involvement
-
Encourage CSDK (Sisense's SDK) adoption for embedding
Research Insights
Problem | Solution |
|---|---|
Users leave the system to search externally
(Community, Academy, etc.) | Integrated service suggestions to reduce drop-offs at the results stage |
Users want quick, simple answers - avoid reading long texts | Highlighted key insights, added wizards and comparison tables |
Users don’t understand the task flow or what to do next | Built a guided interface with clear step-by-step navigation |
User Flow

Solution 1 - Wizards & Comparison Tables
A successful onboarding must take into account two core success factors:
-
What the user needs to do
-
What the user needs to know in order to do it
What we did
Instead of leaving the product to read complex docs, users now answer up to three quick questions, get a clear recommendation, and compare options in a simple table - all inside the platform

Solution 2 - Sidebar Redesign
The initial review showed the sidebar was confusing for new users due to lack of clear hierarchy during the onboarding stages. A competitive review revealed the need for clear steps and friendly visuals.
What we did
-
Essential steps were redefined and main pages vs. subpages mapped with indentation for hierarchy
-
Icons and connecting lines were added to illustrate progress between steps
-
Color indicators were introduced to highlight the user’s current position
These design improvements follow Gestalt principles, using visual grouping to help users quickly grasp structure and flow.
Old Sidebar
.jpg)
New Sidebar


Project 2 - AI Assistant
Key KPIs
-
Ensure new users engage with the AI Assistant as part of their initial workflow
-
Enable users to complete core data tasks without switching to manual workflows
-
Achieve an average satisfaction score of 4 or higher (out of 5) in post-interaction survey

Usability Testing
-
Research Question: Do users understand how to use the AI feature and operate it intuitively?
-
Target Audience: Tech-savvy high-tech employees (non-data experts)
-
Method: Mixed qualitative & quantitative (task time, errors, facial expressions, spoken feedback)
-
Format: Formative study, small-scale, scripted scenario for all participants
Results


Conclusions
-
Overall task completion rates were high
-
However, icon recognition scores showed significant gaps
-
This suggests some tasks were completed by trial and error rather than clear understanding
-
Hidden frustration emerged beneath the surface of success, revealing usability issues not visible in raw success rates alone
Project 3 - Usability Improvements
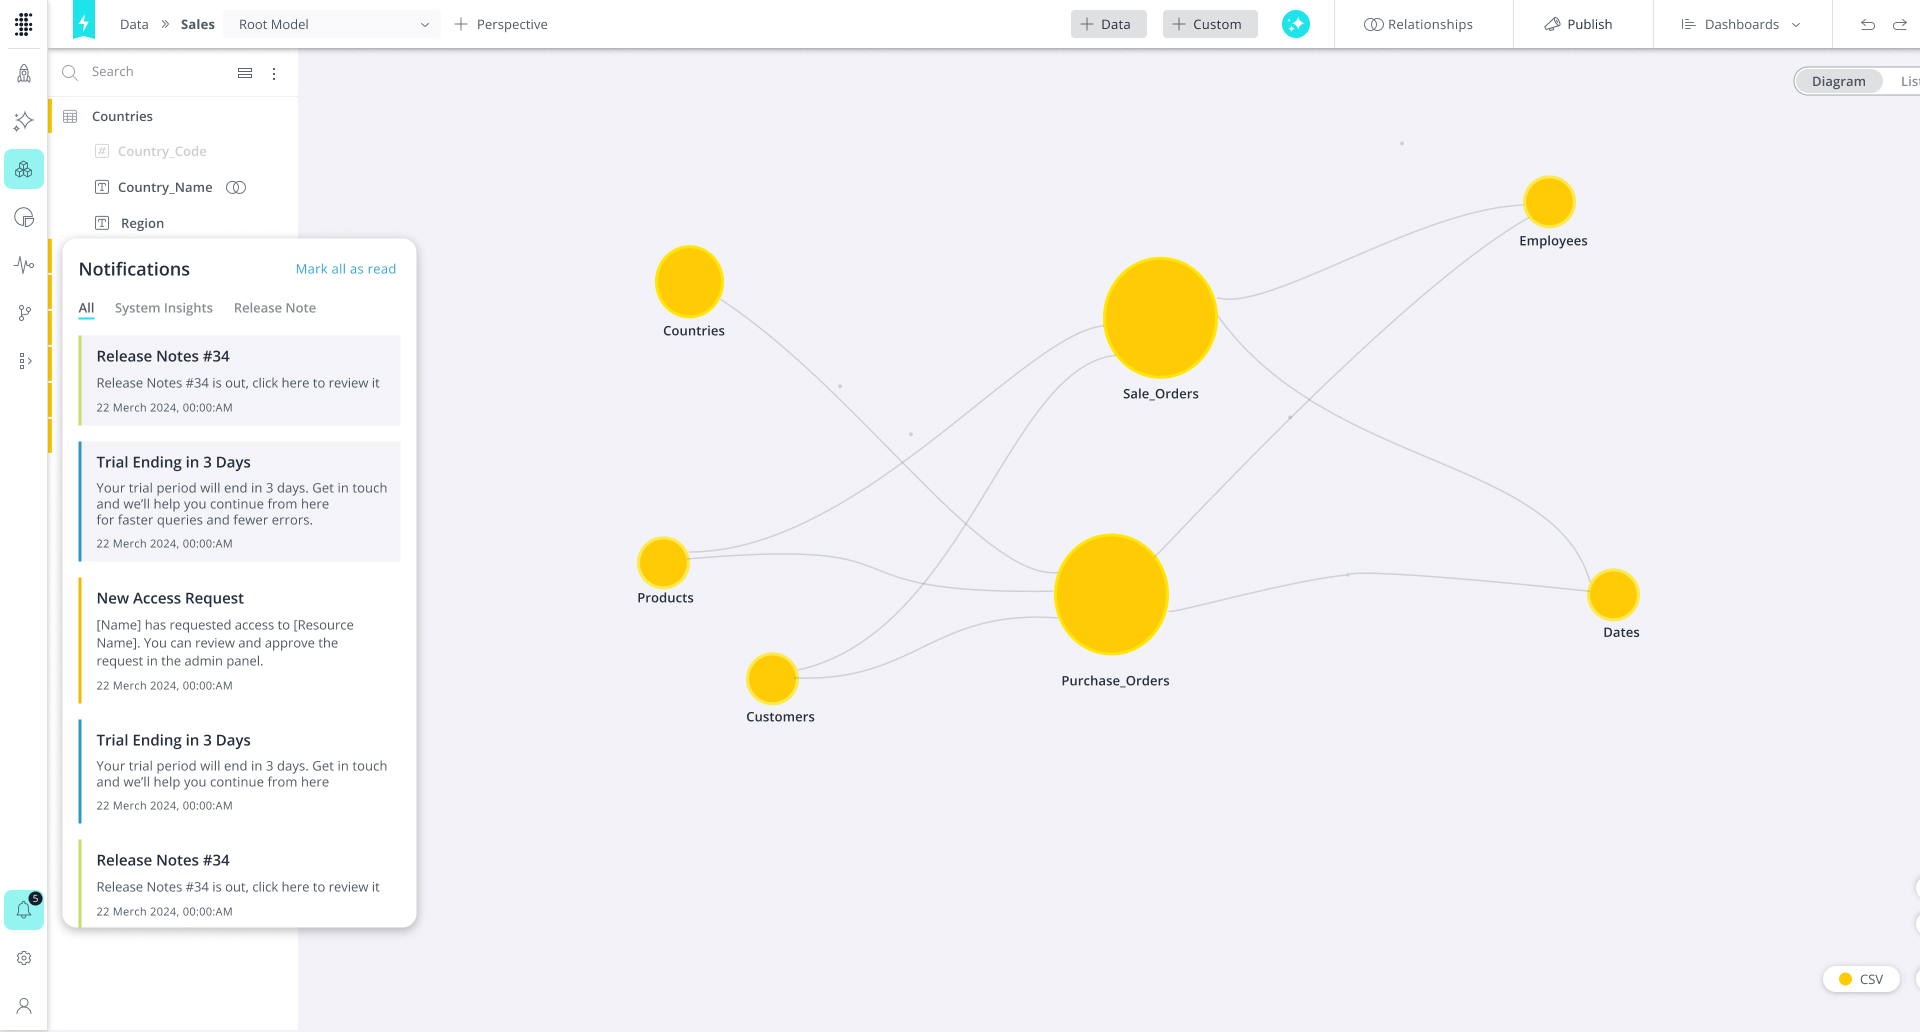
Notifications Center
-
Revived an outdated feature that hadn’t been maintained, after identifying a clear need from research
-
Designed a centralized hub for all user notifications across the platform
-
Added clear color differentiation between notification types to visually separate system alerts, collaboration updates, and other categories
Data Modeling Insights
-
Actionable insights that respond to user actions - Suggestions on how they can do it better or differently
-
Acts like a smart “nudge” to help users notice optimization opportunities
-
Especially useful for users who are less experienced with BI, making advanced workflows more accessible

Feedback From Sisense Product Team
Victor Kaidan, Head of Product Design at Sisense & Internship mentor
It was a pleasure having you at Sisense.
Your curiosity, dedication, and professionalism stood out every step of the way. For us as a company, this internship brought real value - and I believe the benefit was mutual.
Thank you for your time and hard work. I have no doubt you’re well-prepared for your next professional steps, and your future in this field looks very promising. Wishing you all the best!
Neta Levin, Senior Product Designer
Thank you for the perfect work! You jumped right in at record speed and delivered impressive results that helped us cover important gaps we hadn’t managed to address.
It was truly a pleasure getting to know you and working together!
Moran Malachi, Director of Product - Platform & Growth
Thank you for the amazing work you did! We learned so much from this process, and there’s no doubt you made a real impact. It was great to work with you and see the professionalism and insights you brought to the table. Best of luck on your journey ahead!
Lani Zipori, Product Manager
You were amazing and did an outstanding job!You got up to speed impressively fast - something that’s never taken for granted in such a short time - and brought valuable, insightful contributions. It was a pleasure working with you.Best of luck on your next steps - any team will be lucky to have you!
.jpg)
.jpg)
.jpg)